
Austin Real Estate Market Update – June 03, 2025
Austin Housing Market Update: Inventory Nears Record Highs as Buyer Activity Stalls
The market still transitioning firmly in favor of buyers, marked by record-high inventory, price stagnation, and suppressed buyer activity despite stable transaction volume compared to historical norms. At the center of the market’s current state is the active listing count, sitting at 17,187—just 150 below the all-time record of 17,337 set on May 26, 2025. This represents a substantial increase from the peak in 2024, which was 15,503 listings on July 15. This year-over-year jump equates to a 10.9% increase in active listings since the previous summer’s high, signaling that inventory is still building and demand is not keeping pace with supply.
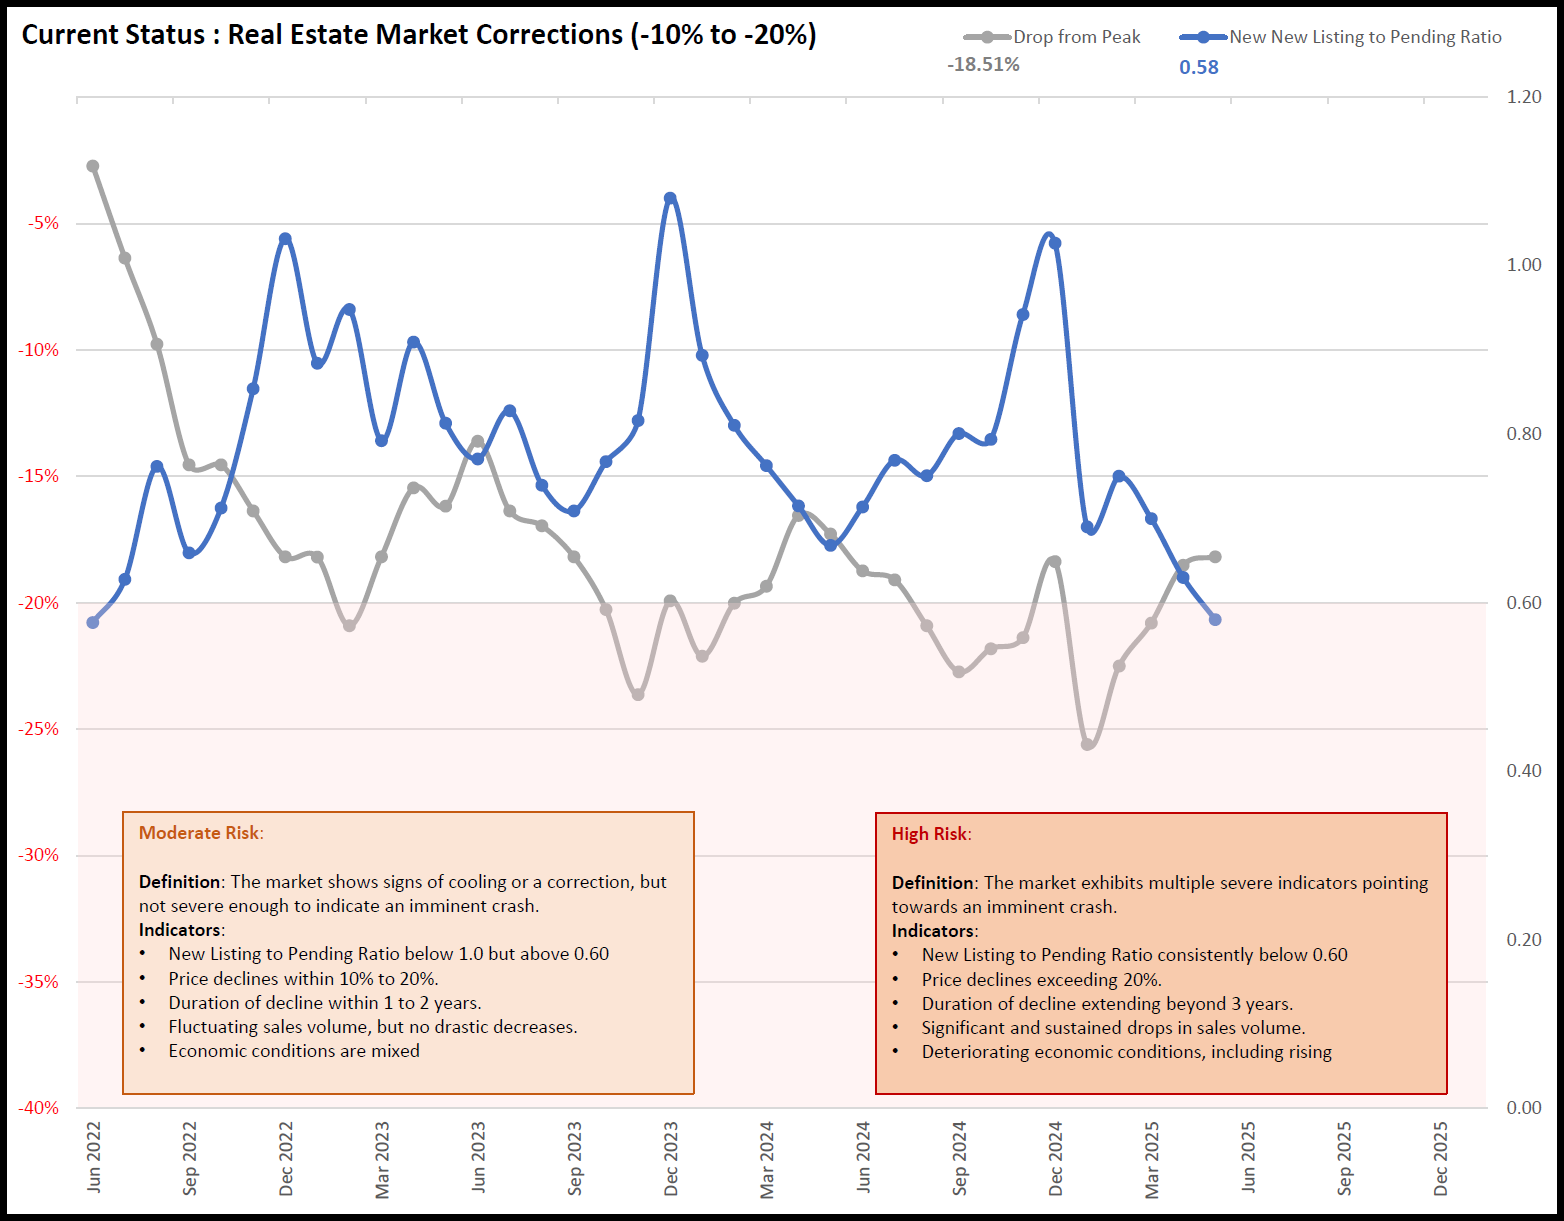
This oversupply environment is further evidenced by the Monthly New Listing to Pending Ratio, currently at 0.58. This means that for every 100 new listings, only 58 are going under contract—far below the 25-year average of 0.81. The year-to-date cumulative ratio is only slightly better at 0.66. These figures clearly define a sluggish absorption rate in the current cycle, reinforcing the notion that Austin is entrenched in a buyer’s market.
The Activity Index, which measures pending listings relative to total actives, has slipped to 21.6%, down from 25.2% a year ago—a 14.2% decline. This continued drop reflects weakening buyer urgency. Historical norms for this index hover closer to 30%, and with more than half of all active listings reporting price reductions (52.5%), sellers are clearly responding to market resistance.
Months of Inventory (MOI) climbed to 6.11, up from 5.06 in June 2024—a 20.9% increase year-over-year. While a balanced market typically sits around 5 to 6 months of inventory, the trend upward—combined with declining Activity Index—suggests growing pricing pressure for sellers. Notably, 19 of the 30 tracked cities have inventory levels above six months, with extreme outliers like Marble Falls and Spicewood at 11.0 months, which are indicative of highly saturated micro-markets.
On the new listings side, the cumulative number of new listings from January through May 2025 totals 24,986—an 8.5% increase from the same period in 2024 and 35.6% above the long-term average. Despite this supply-side surge, pending contracts are not matching the pace. Year-to-date pending listings total 18,980, which is 5.9% above the long-term average but still 6.8% lower than 2024 levels. The cumulative gap between new listings and pending sales—6,006—is the largest imbalance since 2004, when the gap was 6,565. This delta reinforces that inventory growth is not being offset by demand.
Sales volume shows signs of stabilization but still trails recent highs. A total of 11,907 homes have sold from January through May 2025, a 9.3% increase over the long-term average, yet a 9.3% decrease compared to the same period last year. When adjusted for population, sales density paints a more concerning picture: only 468 homes sold per 100,000 population—a full 19.2% below the long-term average and down 11.4% year-over-year. Moreover, sales per 1,000 active Realtors sit at 640—23.8% below average and down 5.7% from 2024. This means that on a per-agent and per-capita basis, fewer transactions are happening despite a higher inventory base.
Price trends reinforce this cooling cycle. The current median sold price is $450,000, down 18.18% from the May 2022 peak of $550,000. The average sold price now stands at $593,386, down 12.99% from its 2022 high of $681,939. Both figures continue to confirm a multi-year correction in home prices. Year-over-year median sold price for May 2025 declined 1.1%, and the average price dropped marginally by 0.1%. This suggests that while the majority of the price reset has already occurred, we are not yet seeing signs of recovery.
The 25-year compound appreciation rate in Austin is 4.981%. Applying this historical rate to today’s median of $450,000 implies a 52-month horizon—August 2029—before home values recover to the 2022 peak of $551,386. This long path to recovery underlines the structural nature of the correction.
A deeper dive into the price distribution reveals that both the top and bottom quartiles are experiencing similar declines. The bottom 25th percentile of homes has seen a 2.8% decrease in median price and a 3.5% drop in price per square foot. The top 25th percentile has fared slightly better but still posted a 2.2% decline in price and a 3.2% reduction in price per square foot. These nearly parallel reductions across price tiers suggest the correction is systemic and not isolated to luxury or entry-level segments.
The city-level appreciation data reflects a mixed landscape. Among the 30 tracked cities, 18 have shown year-over-year gains in median price, 11 have declined, and 1 remained flat (Jarrell). This dispersion highlights how hyper-local conditions—like inventory pressure, job growth, or migration patterns—continue to drive differentiated outcomes. For example, Liberty Hill and Marble Falls have experienced high inventory growth and thus more price compression, whereas markets with constrained supply or strong school districts have seen price resilience.
Two other indicators support the ongoing buyer’s market narrative. The Market Health Index (MHI) is at 19.1%—well below the 30% threshold that traditionally delineates balanced from buyer-favored conditions. Similarly, the Inventory Stress Index (ISI), at just 6.1%, suggests low sales pressure and minimal urgency, reinforcing a landscape of extended market times and increased buyer optionality.
In summary, the Austin real estate market continues to recalibrate. With active listings nearing record highs, new supply outpacing demand, and home prices down significantly from peak levels, buyers now have leverage they haven’t seen in years. The combination of low absorption rates, higher months of inventory, and stagnant pricing is not just seasonal but structural. This environment rewards well-informed buyers and brokers who understand localized pricing dynamics and market segmentation. For sellers, accurate pricing and strong listing presentation are essential, as overpricing leads to quick stagnation and inevitable price cuts—something more than half the market is already experiencing. Looking ahead, unless demand meaningfully rebounds or supply contracts, the trend lines suggest a continued plateau or further softening through the rest of 2025.
Austin Real Estate Market – Frequently Asked Questions (June 3, 2025)
1. Is the Austin housing market crashing in 2025?
No, the Austin housing market is not crashing, but it is undergoing a sustained correction. At Team Price Real Estate, we track market data daily and rely on both leading and lagging indicators to determine the health of the market. To classify as a “crash,” two key conditions must be met: (1) home prices must decline by 20–25% or more over a prolonged period, and (2) the New Listing to Pending Ratio must stay below 0.60 for at least three consecutive months. As of June 3, 2025, Austin’s median sold price has declined 18.18% from the May 2022 peak of $550,000 to $450,000, and the New Listing to Pending Ratio is currently at 0.58. While these numbers are concerning, they do not yet meet the technical threshold for a crash. That said, the market could transition into a crash if these indicators continue in this direction, and we will be the first to call it when that threshold is met.
2. What is the current state of inventory in Austin's housing market?
Inventory is at historic highs. As of June 3, 2025, there are 17,187 active residential listings in Austin, nearly matching the all-time record of 17,337 set just days earlier. This reflects a 10.9% year-over-year increase. From January through May 2025, 24,986 new listings have hit the market—35.6% above the long-term average. However, demand has not kept pace, with only 18,980 pending contracts recorded year-to-date. The result is a growing inventory imbalance and a Months of Inventory figure of 6.11, up from 5.06 a year ago. This level of supply, combined with slower absorption, signals a market that strongly favors buyers.
3. How are home prices trending in Austin?
Home prices in Austin have dropped significantly from peak levels. The median sold price is currently $450,000, down 18.18% from the May 2022 high of $550,000. The average sold price has declined by 12.99%, falling from $681,939 to $593,386. While the rate of decline has moderated recently—with the median down just 1.1% year-over-year and the average down 0.1%—the overall trajectory continues to reflect price softening. Price reductions are widespread, and elevated inventory continues to apply downward pressure on home values across all price tiers.
4. Is it a good time to buy a home in Austin?
Yes, the current market presents favorable conditions for buyers. Team Price Real Estate’s Activity Index—a measure of buyer activity relative to inventory—is at 21.6%, well below historical norms. The New Listing to Pending Ratio is 0.58, compared to the 25-year average of 0.81, indicating slow absorption. Over half (52.5%) of active listings have seen at least one price cut, and Months of Inventory is elevated at 6.11. These trends provide buyers with more choices, less competition, and stronger negotiating leverage. For well-qualified buyers looking for long-term value, this is one of the most advantageous periods in years.
5. What should sellers consider in the current market?
Sellers are facing a highly competitive environment and need to price strategically. Team Price Real Estate reports a year-to-date difference of 6,006 more new listings than pending contracts—marking the largest inventory imbalance since 2004. With the median price down 18.18% from peak and more than half of listings experiencing price reductions, buyers are cautious and value-driven. To succeed, sellers must price realistically from day one, ensure strong presentation, and be open to market feedback. Proper preparation and the guidance of an experienced, data-informed agent are essential in converting showings into offers in today’s slower-moving market.
Have More Questions About the Austin Housing Market? Team Price Real Estate tracks the Austin market daily and publishes the most comprehensive, up-to-date real estate data available. If you have questions about specific neighborhoods, property values, or market timing, we’re here to help. Reach out to us directly—we’re happy to walk you through the numbers and what they mean for your situation.
Have a Question or Want to Dive Deeper?
If you’d like a custom breakdown of the data, want help interpreting today’s market trends, or just have a question about buying or selling in Austin, let us know. Fill out the form below and a member of our team will get back to you promptly.
